From Chaos to Clarity: Centralizing OpenTelemetry Metrics in Distributed Microservices with NestJS and Prometheus

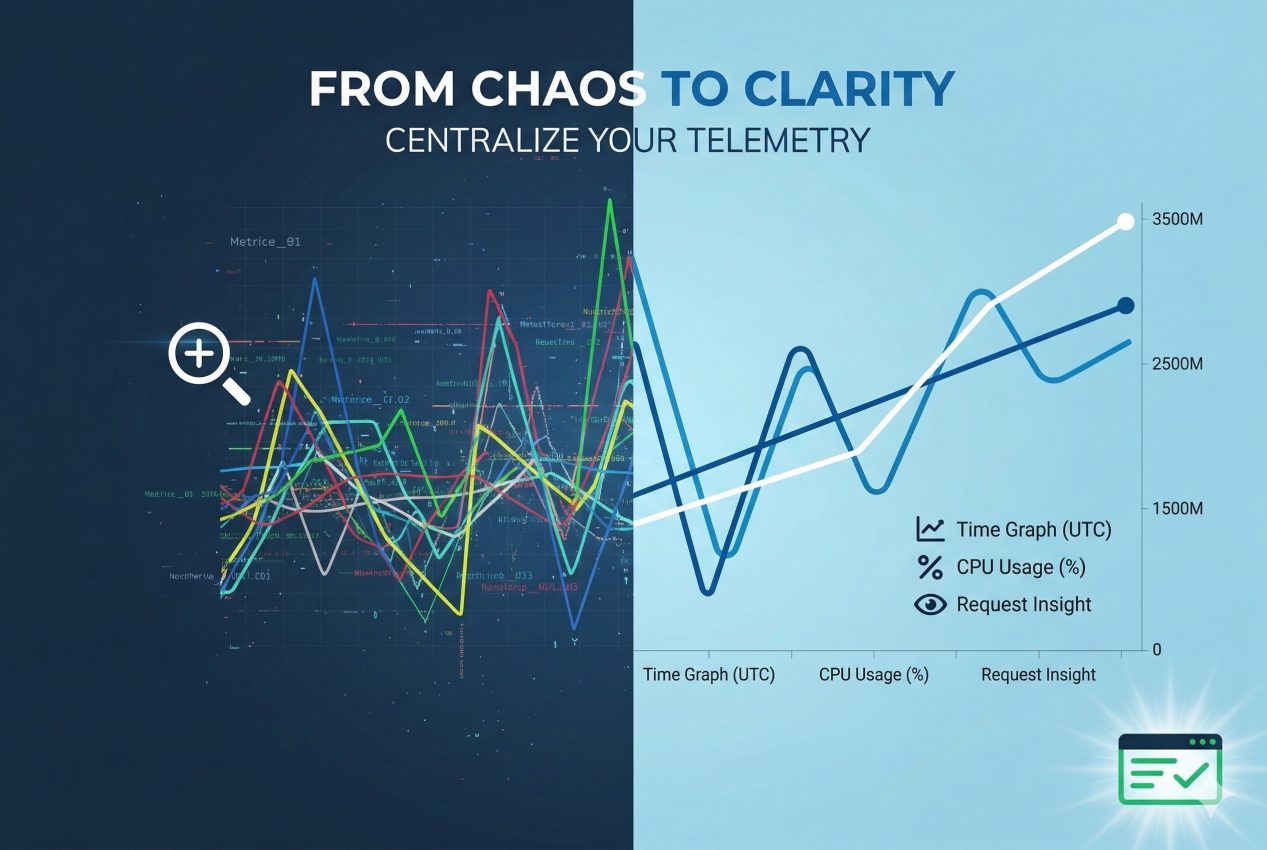
In the world of real-time data extraction, observability isn’t a luxury – it’s survival.
At Bringits, our thousands of microservices collect and process millions of data points daily from hundreds of providers and feeds. Ensuring system health, detecting anomalies before they impact users, and scaling with confidence all depend on how well we monitor what’s happening under the hood.
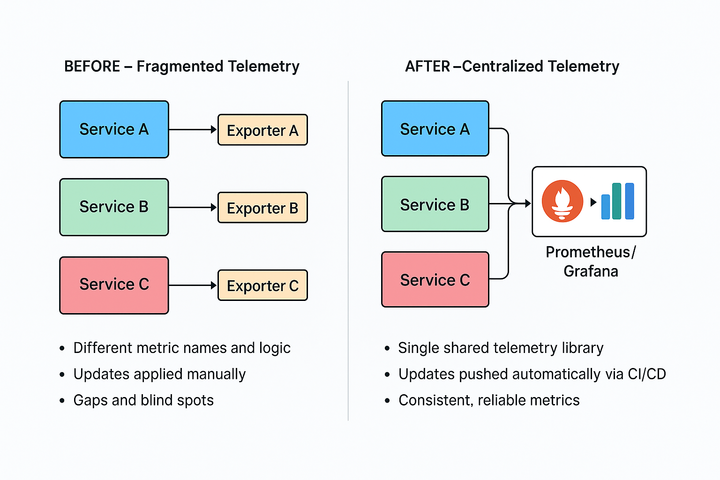
Our previous monitoring setup, however, was heavily fragmented. Each microservice maintained its metric logic, exporters, and naming conventions, resulting in inconsistent data and blind spots.
Even small changes – like adding a label or fixing an exporter – required modifying dozens of codebases. This slowed down our ability to detect and respond to production issues.
That’s where OpenTelemetry came in.
OpenTelemetry is an open-source observability framework that provides standardized APIs, SDKs, and tools to collect, process, and export telemetry data – such as metrics, logs, and traces – from distributed systems.
By adopting OpenTelemetry, we aimed to unify how we instrument our services, centralize telemetry data, and make cross-service analysis far more reliable and efficient.
🚨 The Observability Challenge
Before implementing OpenTelemetry, monitoring API latencies, request volumes, or failure patterns across environments was fragmented.
Each service had its logic, partial metrics, and separate exporters – making it harder to answer basic questions like:
- Why is this Kafka message delayed?
- Which collector is showing spikes in error rates?
- Are we staying within our expected SLA?
Observability is only one part of operating distributed workloads at scale. Queue architecture also plays a critical role in isolating workloads and preventing resource contention, as explored in our deep dive into BullMQ Pro’s Group feature.
Why Centralization Was Critical
Before we built the solution described below, each service maintained its telemetry setup. This led to several issues:
- Duplicated effort: Dozens of teams implemented the same metric logic separately.
- Inconsistent data: Metric names, labels, and retention varied between services, making cross-service analysis difficult.
- Slower updates: Adding new labels or adjusting histogram buckets meant editing and deploying changes across hundreds of codebases.
- Blind spots: Partial or missing instrumentation left gaps in our observability and slowed down root cause analysis.
By centralizing the logic into a single, reusable module, we were able to:
- Enforce consistent metric standards across the organization.
- Push updates instantly through CI/CD without touching each microservice.
- Provide plug-and-play telemetry for any new service, drastically cutting onboarding time.
- Gain unified visibility of the entire system’s health at scale.
This centralization became the foundation for the step-by-step rollout of our OpenTelemetry-based observability stack.
🎯 The Solution: OpenTelemetry + NestJS + Prometheus
We built a unified, company-wide telemetry setup using OpenTelemetry, backed by Prometheus for time-series storage and Grafana for visualization.
What We Track:
- Request durations (including p95 / p99 latencies)
- Total request volumes
- Success vs. error statuses
- Flow-specific operations (e.g., scraping, Redis saves, Kafka sends)
For production scraping workloads, this level of observability becomes especially important when requests depend on reliable access to protected websites. A web data unblocker can handle the access layer, while centralized telemetry provides visibility into the performance and reliability of the surrounding services.
With high-resolution histograms, we can analyze patterns per project, service, and flow – with full precision.
🏗️ How We Built It – Step by Step
1. Installing OpenTelemetry in NestJS
We started by adding the necessary packages:
npm install @opentelemetry/sdk-metrics @opentelemetry/exporter-metrics-otlp-grpc
Then, we created a shared metrics.ts file that:
- Configures OTLP exporters
- Initializes the MeterProvider
- Creates histogram metrics for HTTP durations
- Records metrics with custom attributes (like endpoint, method, status)
📌 All endpoint URLs (e.g., OTEL_EXPORTER_OTLP_ENDPOINT) are configurable per environment, so dev/stage/prod metrics flow to the right collector.
2. Instrumenting Controllers
A simple NestJS controller written in TypeScript:
@Get('status')
async getStatus(): Promise<StatusResponse> {
  const startTime = Date.now(); // ⏱ Start measuring response time

  try {
    await simulateDelay(); // Simulates actual work
    recordProcessingTime(startTime, {
      endpoint: '/api/status',
      method: 'GET',
      status: 'success'
    }); // ✅ Record successful duration
    return { status: 'ok', timestamp: new Date().toISOString() };
  } catch (err) {
    recordProcessingTime(startTime, {
      endpoint: '/api/status',
      method: 'GET',
      status: 'error'
    }); // ❌ Record failed duration
    throw err;
  }
}
This records both success and error metrics, with accurate duration.
⚠️ Performance Note: In high-throughput services, we batch or use async-safe patterns to reduce metric overhead.
🔁 Centralizing It All: bringits-otel
To avoid duplicating setup across hundreds of services, we created an internal shared module: bringits-otel.
This service acts as a central hub for:
- Instrumenting services consistently
- Exporting data to Prometheus/Grafana
- Managing compression (gzip), exporters, and configuration
Thanks to this shared layer, any microservice can plug into our observability stack without writing exporter logic from scratch. Updates roll out via CI/CD pipelines automatically.
🔍 Histogram Metrics in Action
When using histograms in OpenTelemetry, we get multiple metrics:
| Metric Name | Description |
|---|---|
http_request_duration_ms_bucket |
Distribution across time buckets |
http_request_duration_ms_count |
Total request count |
http_request_duration_ms_max |
Slowest duration seen |
http_request_duration_ms_min |
Fastest duration seen |
http_request_duration_ms_sum |
Total duration sum |
These metrics allow us to track:
- Average durations – a high-level health indicator.
- p95 and p99 percentiles – highlight outlier requests that impact real users, even when averages look fine.
- Volume spikes and error rates – reveal performance issues during traffic surges.
- Flow-specific operations (e.g., Redis writes, Kafka sends) – pinpoint bottlenecks inside pipelines.
By correlating these metrics, we can quickly understand whether a slowdown is isolated to a single operation (e.g., Redis writes) or systemic across services.
This makes root cause analysis faster and improves how we tune performance.
📈 Real Examples from Production
In production, these metrics help us quickly correlate issues across services:
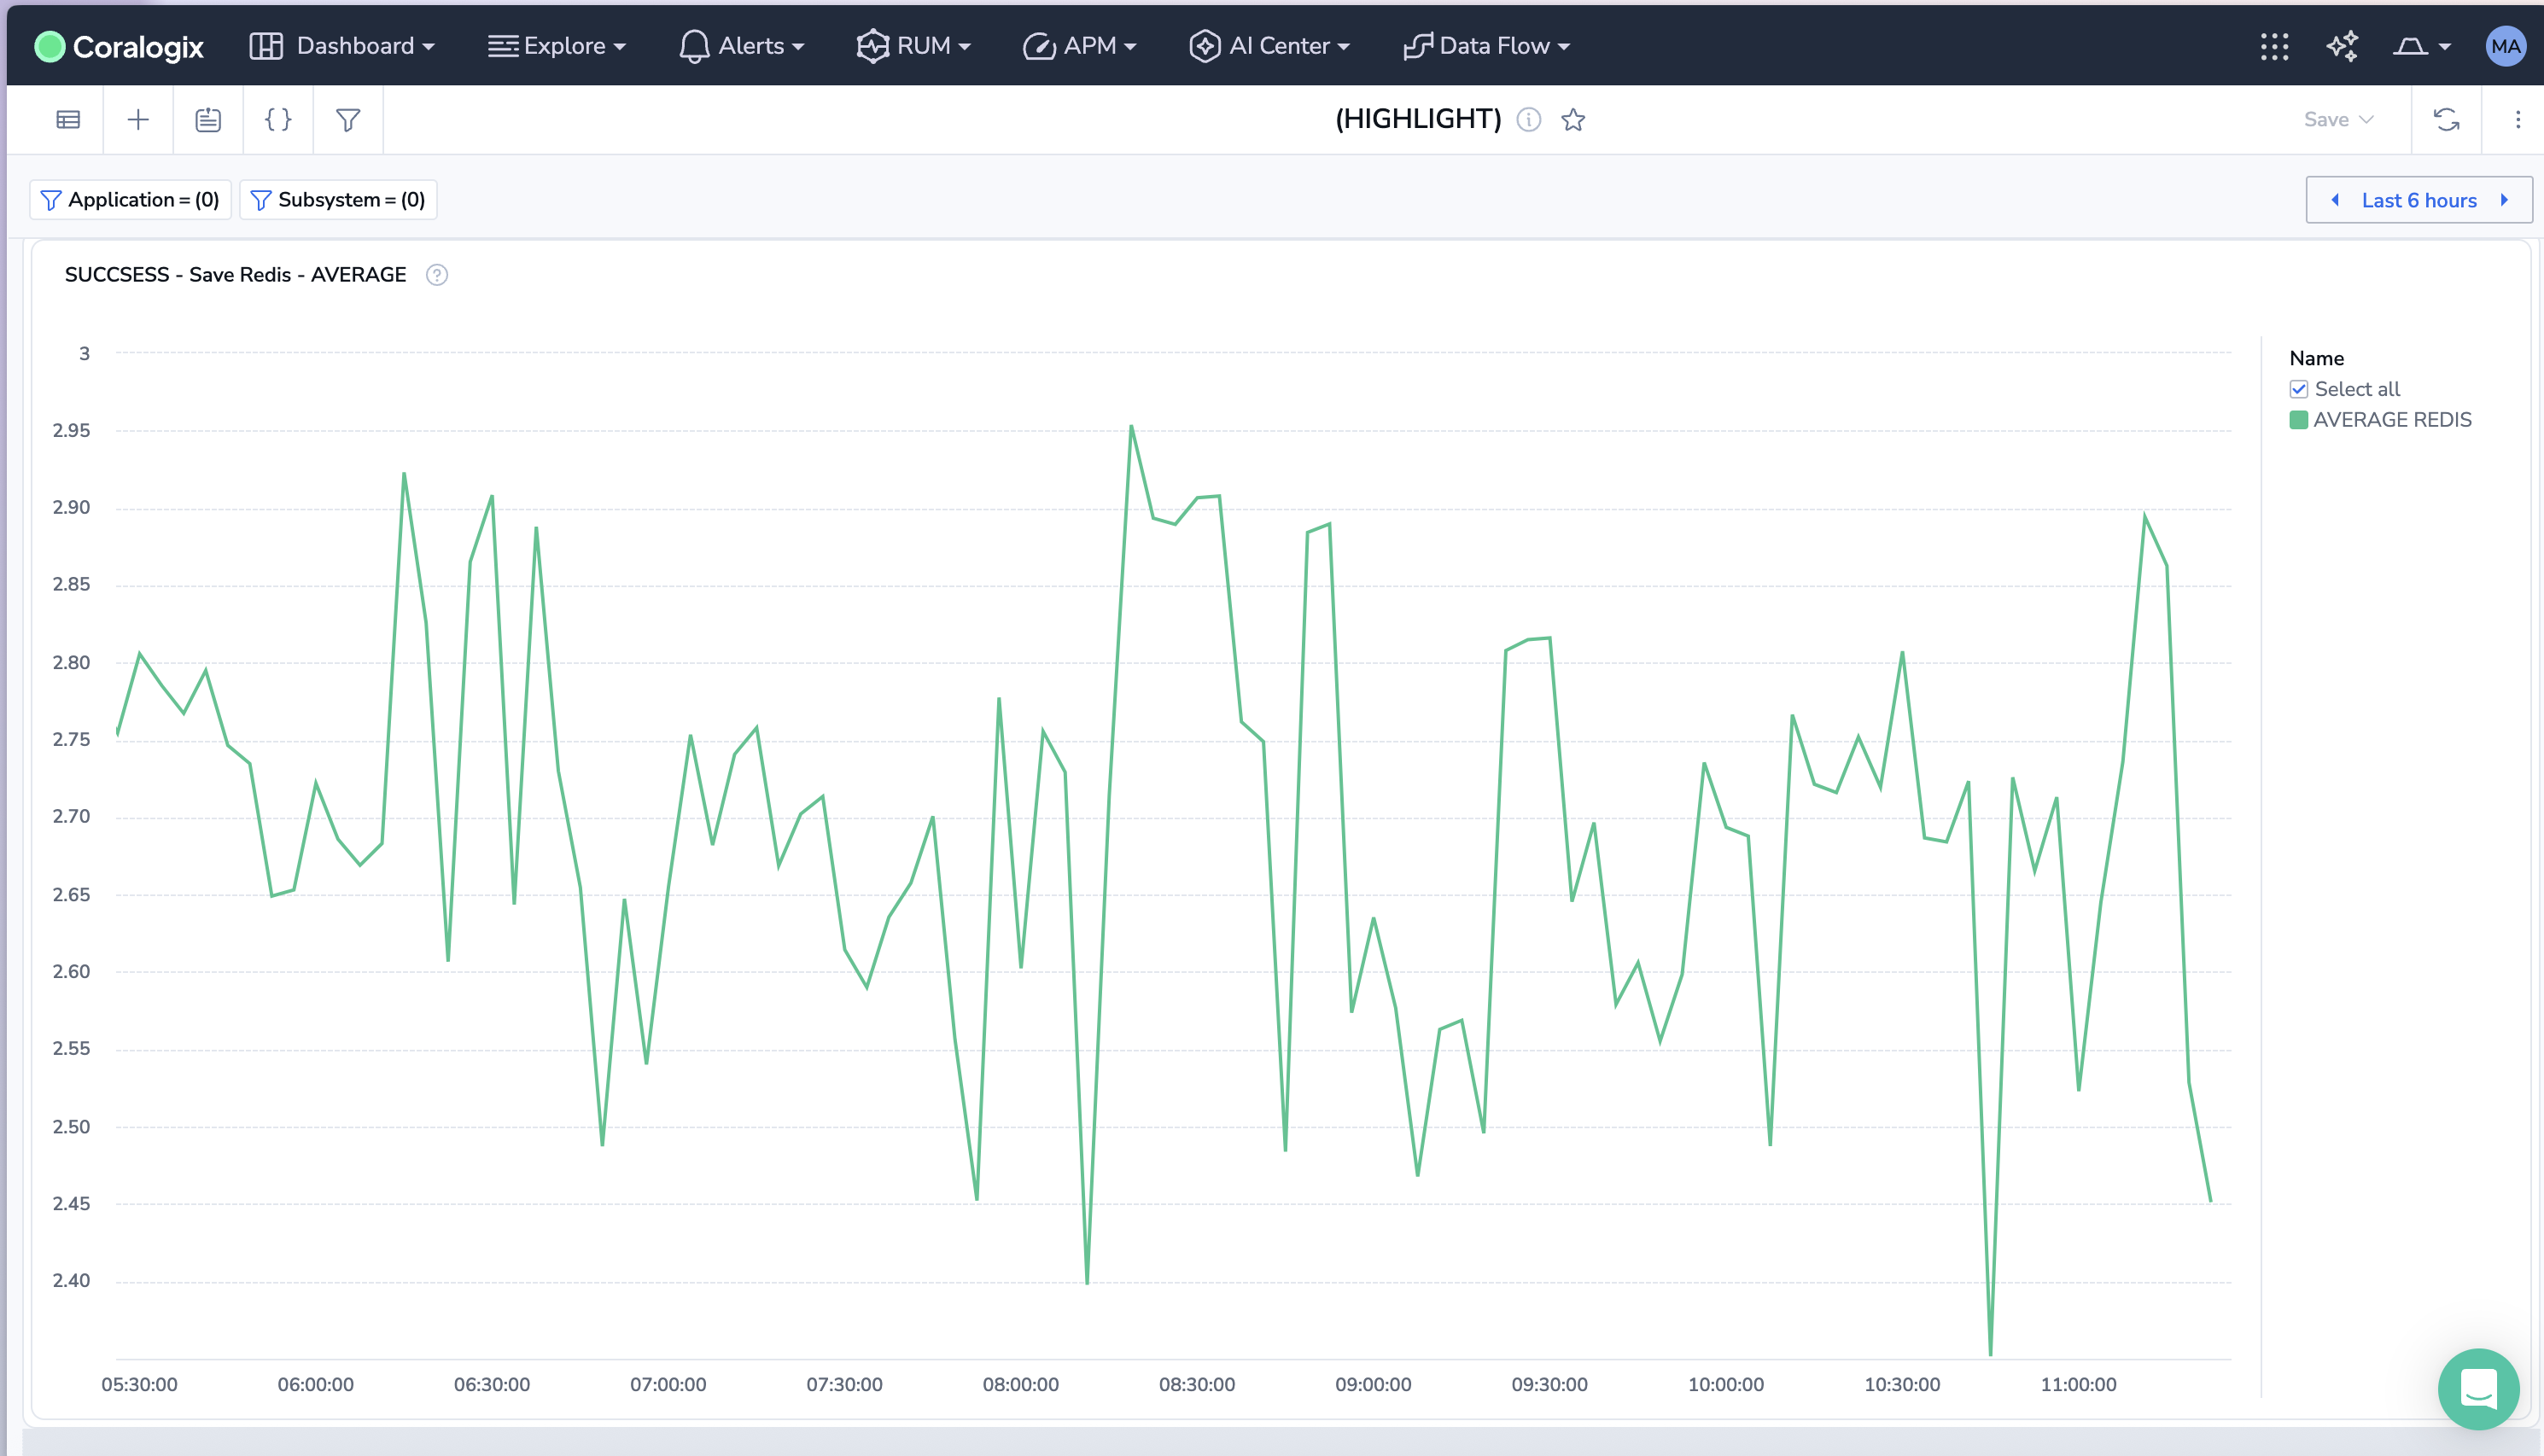
✅ Average request duration per project – e.g., tracking Redis write times shows whether latency spikes originate at the database layer:
sum(rate(message_processing_duration_ms_sum{flow="save_raw_data_redis", status="Success"}))
/ sum(rate(message_processing_duration_ms_count{flow="save_raw_data_redis", status="Success"}))
/ 1000
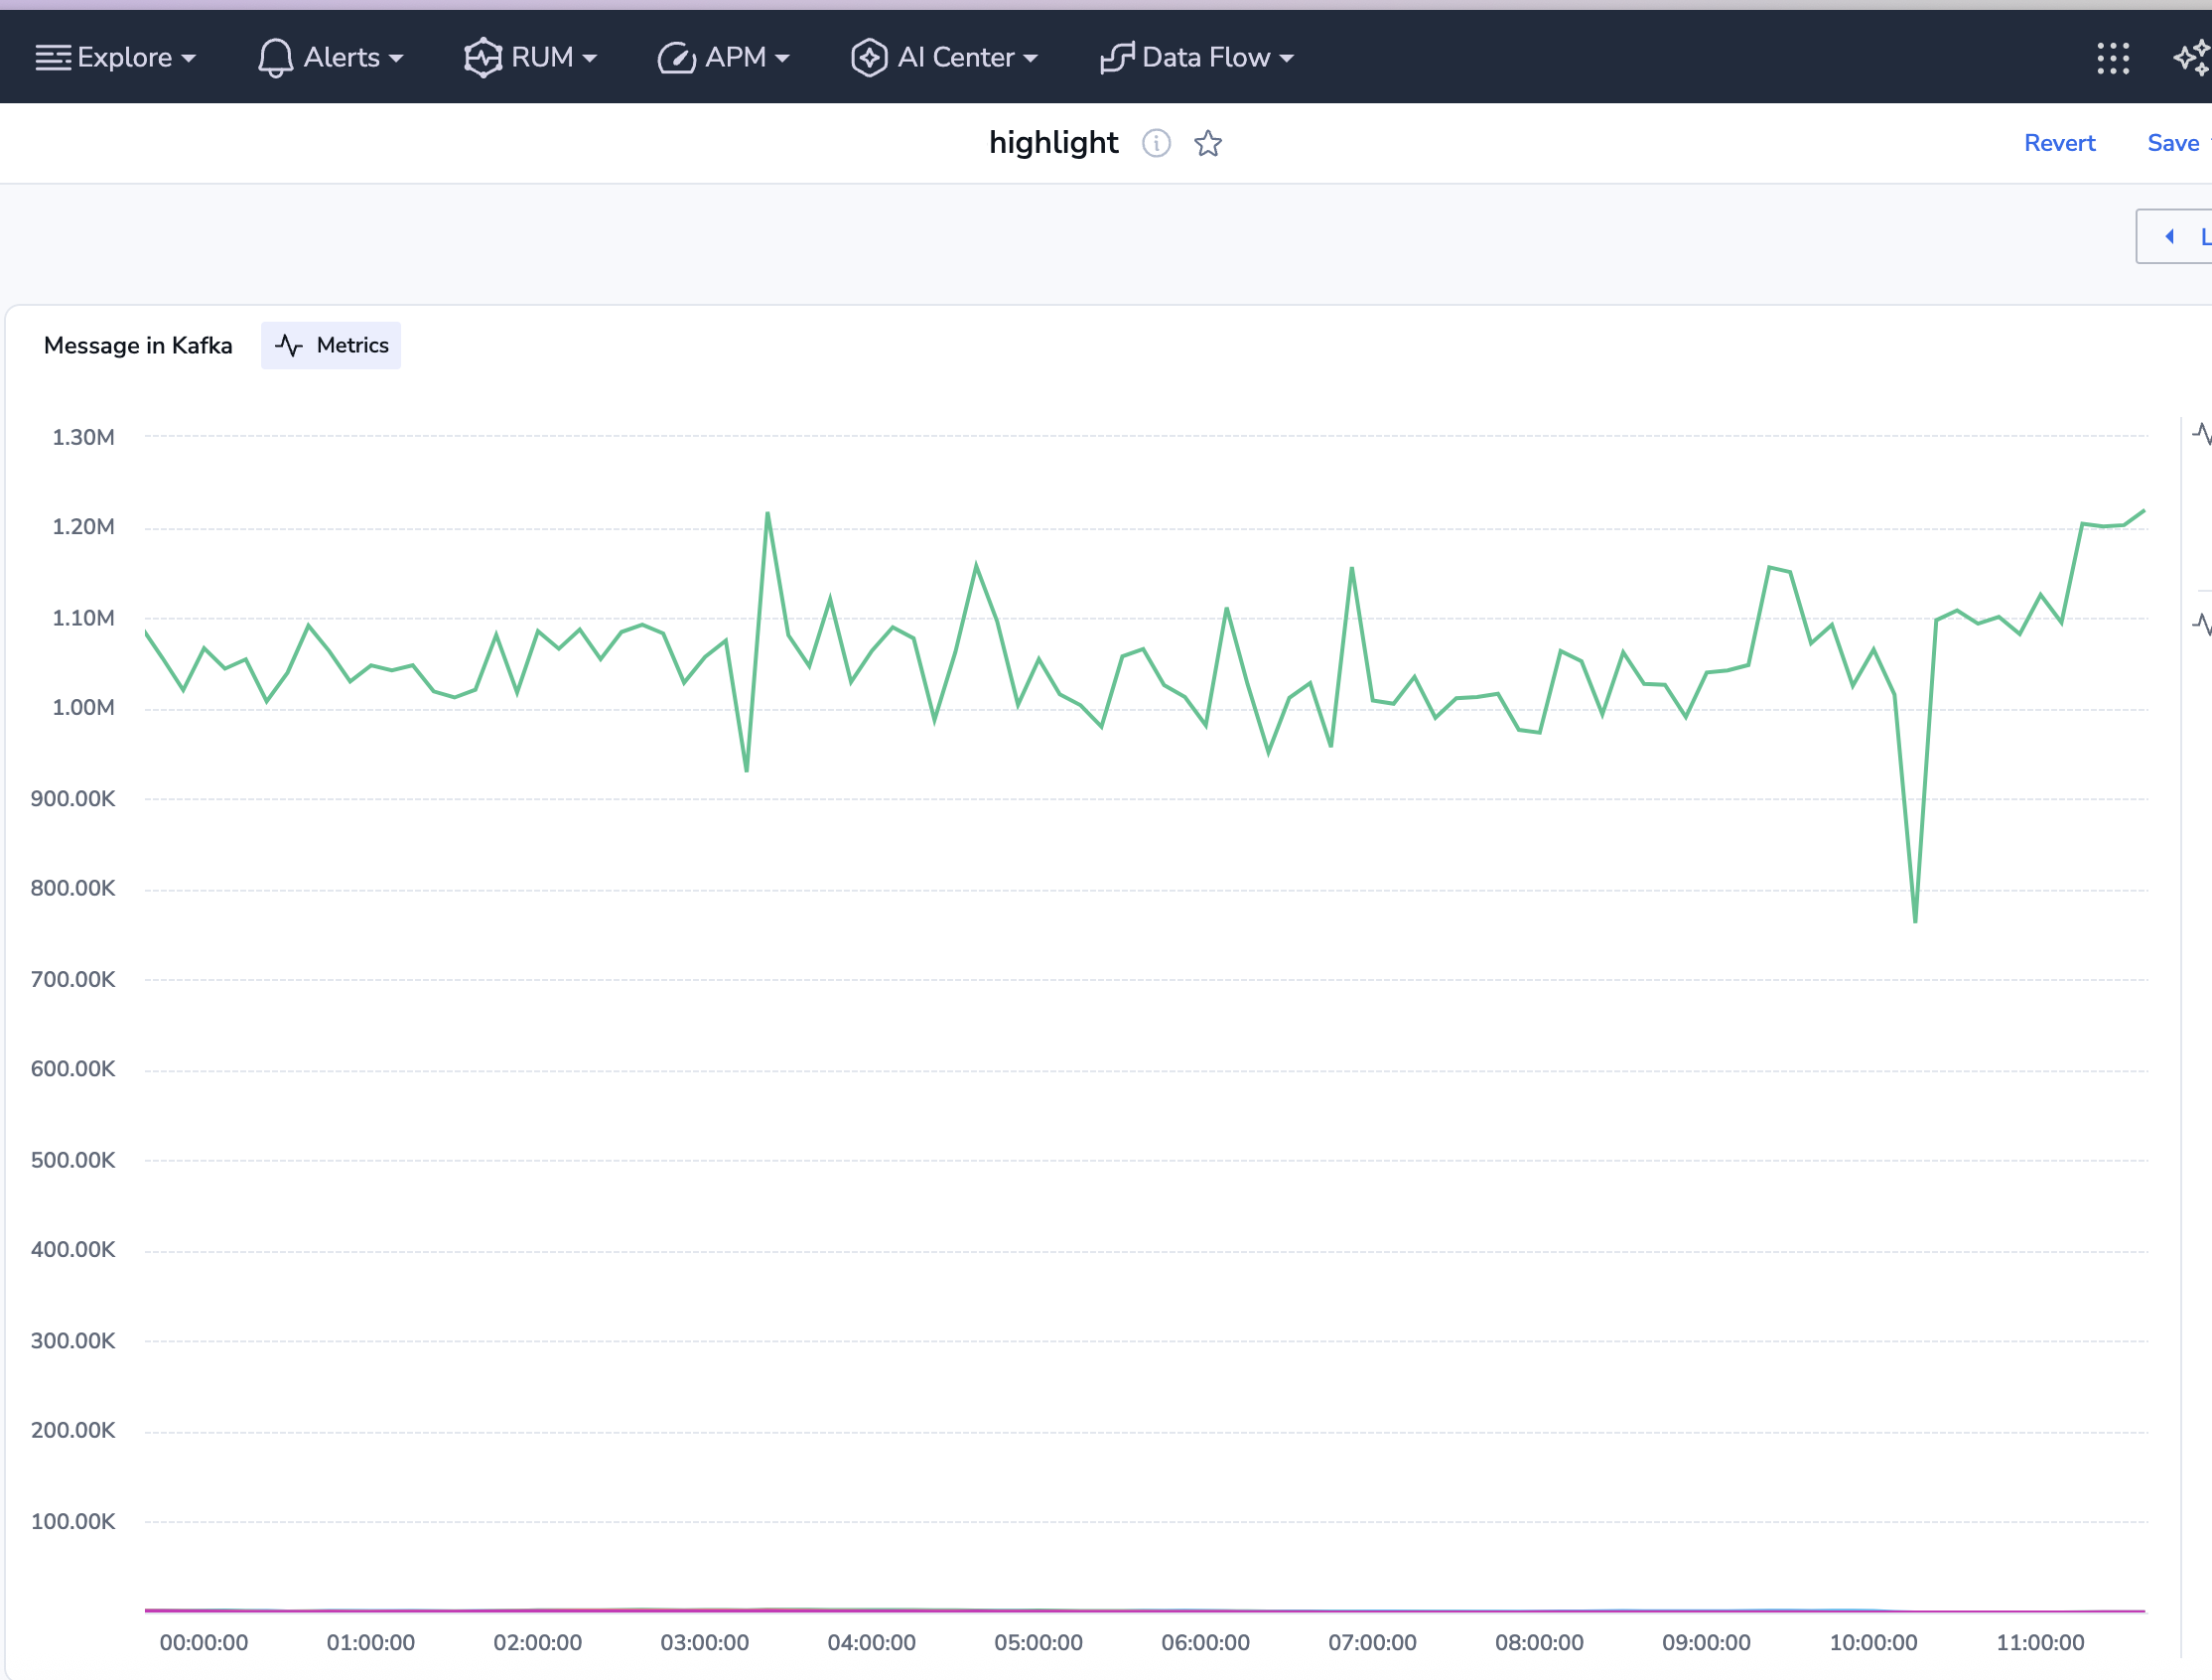
Total Kafka sends per project – helps identify bottlenecks in event distribution and throughput issues.
sum(increase(message_processing_duration_ms_count{flow="send_message_to_kafka", status="Success"}[10m])) by (project_name)
P95 latency for data collection flows -surfaces the slowest data ingestion operations that impact downstream pipelines.
histogram_quantile(0.95, sum(rate(message_processing_duration_ms_bucket{
  project_id=~".*", service_name="{seervice_name}", status="VALID"}[2m])) by (le)) / 1000
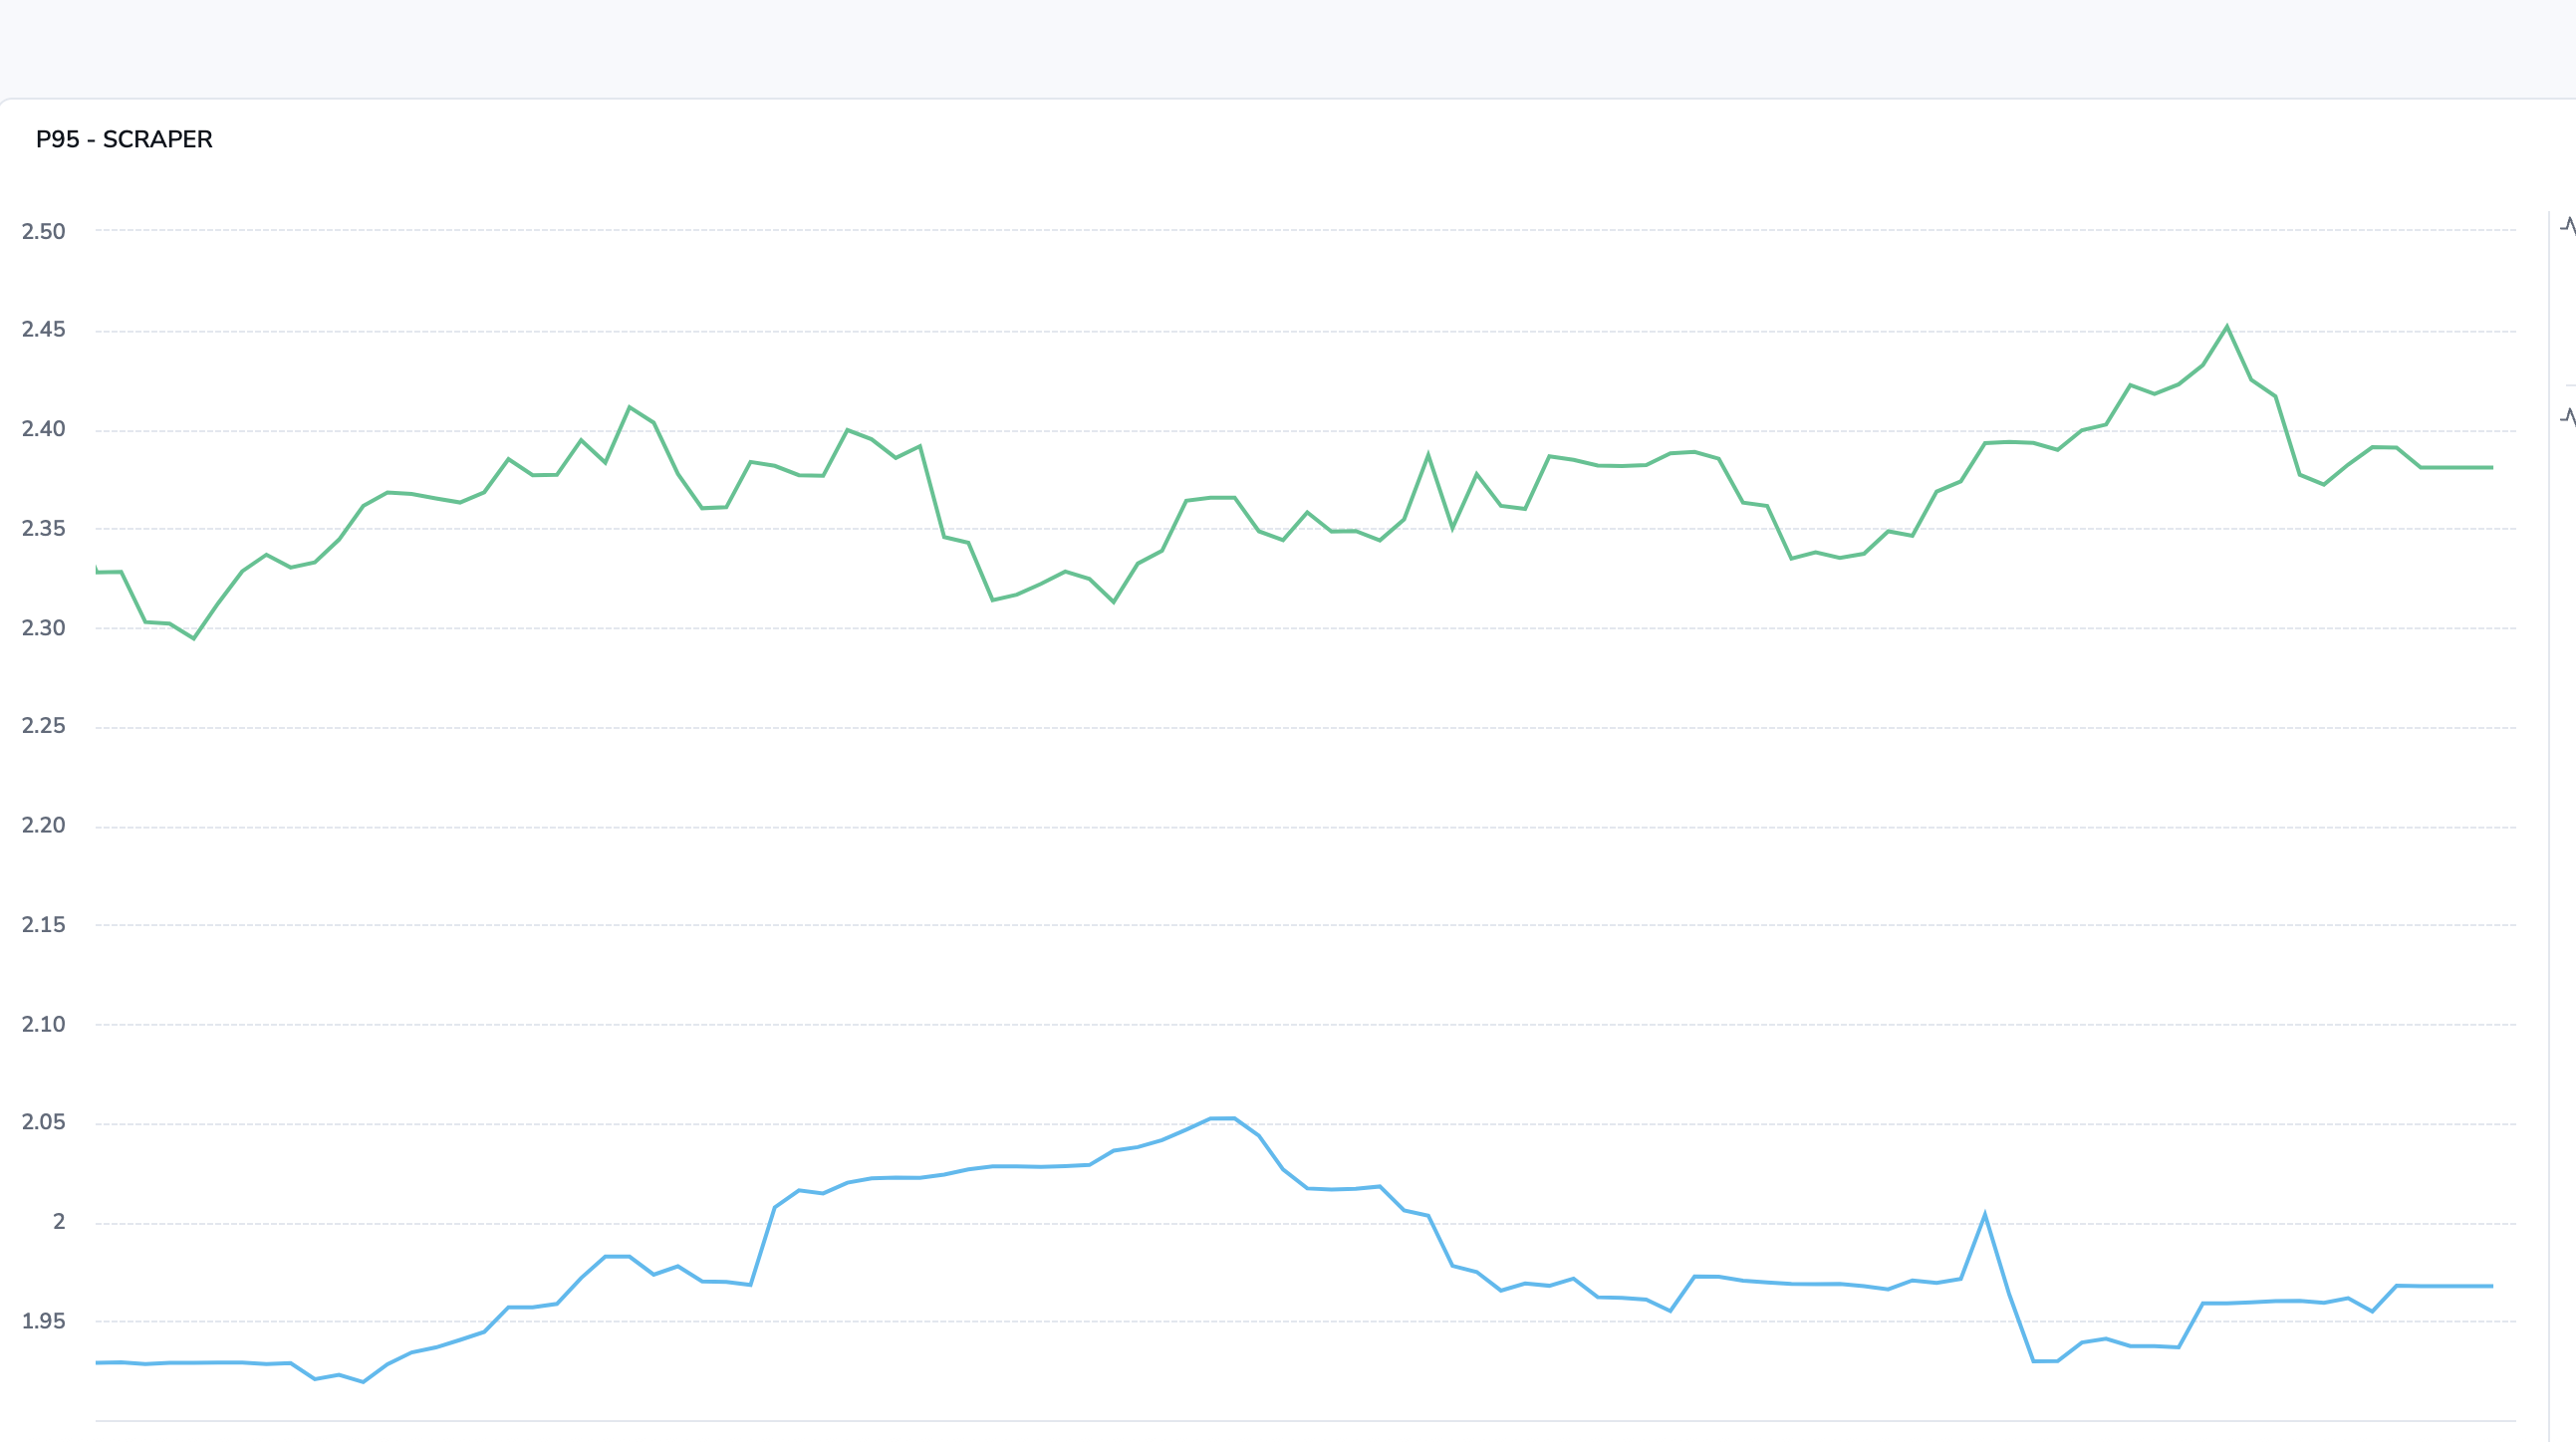
By correlating these signals, we can immediately see whether a slowdown is tied to a single operation (e.g., Kafka sends) or is systemic. This reduces root cause analysis time and allows us to tune performance far more effectively.
🧠 Summary – What We Gained at Bringits
Real-time tracking of scraping, Redis, and Kafka.
- Consistent metrics across 100% of services, eliminating gaps and blind spots.
- Histogram-based monitoring with ms-level granularity, enabling deeper performance insights.
- Percentile-driven visibility (p95, p99) to quickly identify latency outliers affecting user experience.
- Reduced Mean Time to Detection (MTTD) by 40%, thanks to standardized alerting and unified dashboards.
- Lowered latency variance by 25%, allowing us to meet strict SLA targets with greater confidence.
- A modular SDK (
bringits-otel) is reused across all services, cutting onboarding time for new services by over 50%. - Real-time tracking of data ingestion, Redis, and Kafka operations without adding logging overhead.
This setup now empowers every engineer to trace, tune, and trust their services – even during global-scale traffic spikes.
Checklist: Replicating This Setup
- Standardize your metrics approach
- Define consistent metric names, labels, and retention policies.
- Decide on key metrics (e.g., request duration, error rates, throughput).
- Set up OpenTelemetry in your services
- Install OpenTelemetry SDKs in your chosen framework (e.g., Node.js/NestJS).
- Create a shared metrics configuration file (
metrics.ts) for exporters, histograms, and attributes.
- Centralize instrumentation
- Build a reusable module (like
bringits-otel) for metrics logic. - Ensure all services integrate with this module instead of rolling their own exporters.
- Build a reusable module (like
- Integrate with a backend
- Choose a metrics backend (Prometheus recommended).
- Connect to visualization tools like Grafana for dashboards and alerts.
- Automate updates
- Push configuration and instrumentation updates via CI/CD pipelines.
- Ensure environment-specific configs (dev, stage, prod) are easy to manage.
- Validate and monitor
- Validate metric consistency across services.
- Set up SLOs, alerts, and percentile-based thresholds (p95/p99) for performance tuning.
Frequently Asked Questions About Centralized OpenTelemetry Metrics
Learn how Bringits centralized observability across distributed microservices using OpenTelemetry, NestJS, Prometheus, and Grafana. These FAQs cover the architecture, metrics, histogram monitoring, and the benefits of standardized telemetry at scale.
Why did Bringits centralize metrics across its microservices?
Before centralization, each microservice maintained its own metric logic, exporters, and naming conventions. This resulted in duplicated effort, inconsistent data, slower updates, and observability blind spots. Centralizing the logic into a reusable module allowed Bringits to enforce consistent metric standards and gain unified visibility across the entire system.
How does Bringits use OpenTelemetry with NestJS and Prometheus?
Bringits uses OpenTelemetry within its NestJS services to collect and standardize telemetry data. The setup uses Prometheus for time-series storage and Grafana for visualization, creating a unified observability stack for monitoring distributed services.
What metrics does Bringits track with OpenTelemetry?
The system tracks request durations, including p95 and p99 latencies, total request volumes, success and error statuses, and flow-specific operations such as scraping, Redis saves, and Kafka sends. High-resolution histograms make it possible to analyze these patterns by project, service, and flow.
What is bringits-otel and why was it created?
bringits-otel is an internal shared module created to avoid duplicating telemetry setup across hundreds of services. It provides consistent service instrumentation, exports data to Prometheus and Grafana, and manages compression, exporters, and configuration. Updates can then be rolled out automatically through CI/CD pipelines.
How do histogram metrics help identify performance issues?
Histogram metrics provide information such as request counts, duration distributions, minimum and maximum durations, and total duration. They also enable p95 and p99 percentile monitoring, helping identify latency outliers, traffic spikes, error rates, and bottlenecks in operations such as Redis writes or Kafka sends.
What results did Bringits achieve by centralizing its observability stack?
According to the article, Bringits achieved consistent metrics across 100% of its services, reduced Mean Time to Detection (MTTD) by 40%, lowered latency variance by 25%, and cut onboarding time for new services by more than 50%. The centralized setup also enables real-time tracking of data ingestion, Redis, and Kafka operations.